Your DMARC Report Analyzer Guide for 2026
Learn to use a DMARC report analyzer to turn raw XML data into actionable insights. This guide covers parsing, interpretation, and automation for developers.

John Joubert
Founder, Robotomail

Table of contents
You publish a DMARC record, add a reporting address, and wait for clarity. What arrives is an XML attachment that looks like it belongs in a logging pipeline, not an inbox. It's dense, repetitive, and hard to scan. You can tell it contains something important about who's sending mail with your domain, but you can't answer the question that matters: is this normal, broken, or hostile?
That's where a DMARC report analyzer stops being a nice-to-have and becomes part of the operating model. Parsing one file by hand is annoying. Parsing a steady stream of reports from multiple receivers is wasted engineering time unless the output helps you decide what to fix, what to authorize, and what to block. The useful end state isn't “human-readable XML.” It's a repeatable monitoring loop that tells your team what changed, what failed, and what action belongs in the queue.
The Problem with Raw DMARC Reports
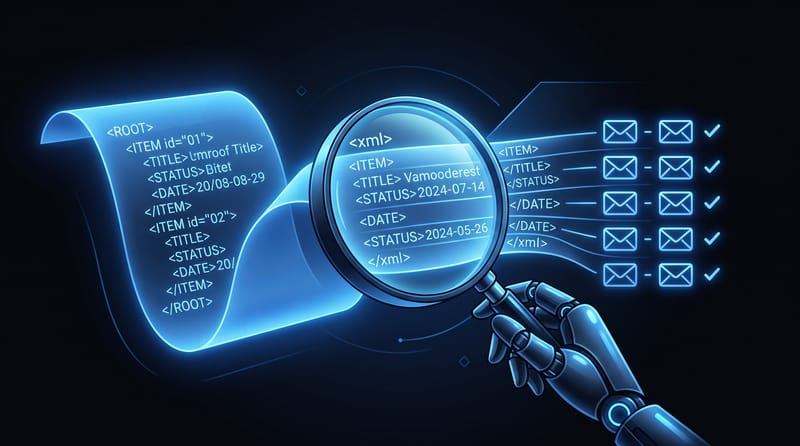
The first raw DMARC report usually creates the same reaction. Someone opens the attachment, sees XML tags, skims for a sender name, and closes it. The report is technically rich but operationally poor if you read it directly.
Mailbox providers send DMARC aggregate reports as XML files to summarize message volume, authentication results, and policy actions. A DMARC report analyzer matters because those reports are high-volume and hard to decipher, and the analyzer converts them into visibility you can use for decisions about your domain's mail flow, as described by PowerDMARC's overview of DMARC report analyzers.
Why the raw file feels useless
The file isn't written for incident review. It's written for machines to exchange structured data. That's fine if you're building a parser. It's not fine if you're trying to answer practical questions during a deliverability issue or a spoofing investigation.
Common problems show up immediately:
- The sender identity is indirect: You might see infrastructure clues, but not a plain-English service name.
- The results are fragmented: SPF, DKIM, alignment, and disposition appear as separate pieces that need context.
- The timeline is awkward: One report doesn't tell you whether this source is new, noisy, or recurring.
- The volume hides priority: A small unknown sender might matter more than a large known sender, but the XML won't tell you that.
Practical rule: If your team is reading DMARC XML in a mailbox, you don't have a DMARC monitoring process yet. You have raw telemetry.
A good analyzer translates the report into sender-level and IP-level visibility. A better one helps you tell the difference between expected third-party traffic, misconfigured legitimate traffic, and traffic that should never have been using your domain.
Deconstructing DMARC Report Formats
Before you automate anything, it helps to know what you're receiving. DMARC reporting isn't one monolithic feed. It's a set of report types with different purposes, different detail levels, and different operational value.

Aggregate reports and failure reports
In day-to-day operations, aggregate reports, often called RUA reports, are the workhorse. They're delivered as XML files by mailbox providers and include message volume, source IPs, SPF and DKIM results, alignment status, pass or fail rates, and the disposition applied by the receiving server, as outlined by Valimail's description of DMARC report analyzer data.
You'll also hear about forensic or failure reports, often referred to as RUF. These are for deeper inspection of individual failures when receivers support them. In practice, organizations spend far more time with aggregate reporting because that's where broad sender inventory and policy monitoring happen.
Think of RUA as a shipping manifest and RUF as an incident sample. The manifest tells you what moved through the system. The sample helps when you need to inspect a specific broken item.
What matters inside an XML report
You don't need to memorize every tag. You do need to know what an analyzer is extracting.
A raw aggregate report typically contains three layers of information:
| Layer | What it tells you | Why it matters |
|---|---|---|
| Report metadata | Who sent the report and what date range it covers | Helps you place results in time and by receiver |
| Published policy | The domain policy and alignment expectations | Lets you compare intended enforcement with observed behavior |
| Record details | Per-source results such as sender, authentication, and disposition | This is where triage starts |
The record details are the operational core. That's where you'll see:
- Source IP information: Which infrastructure originated the mail
- SPF result: Whether SPF authentication succeeded
- DKIM result: Whether DKIM authentication succeeded
- Alignment status: Whether the authenticated identity lines up with the visible domain
- Policy evaluation: What the receiver did with the message under your policy
If your team still treats SPF and DKIM as isolated DNS tasks, it's worth revisiting the broader DNS foundation behind email authentication in this guide to DNS for email.
A parser doesn't create new truth. It pulls structure out of what the receivers already told you.
That distinction matters. A DMARC report analyzer isn't magic. It's a translation layer between machine-formatted evidence and human triage.
How a DMARC Report Analyzer Actually Works
Monday morning, the reporting mailbox has 40 new DMARC messages. Some contain plain XML. Others arrive zipped, use slightly different field naming, or cover overlapping time windows. If the process still depends on someone downloading attachments and skimming rows in a spreadsheet, failures sit longer than they should and unknown senders keep sending.

A useful analyzer turns that inbox noise into a repeatable pipeline. The mechanics are straightforward. The operational value comes from making the output consistent enough to drive triage, alerts, and policy decisions.
Ingesting reports without manual handling
The pipeline starts with collection. Reports usually land in a dedicated mailbox, and the analyzer polls that mailbox over IMAP or pulls from a mail processing workflow. Good implementations also handle compressed attachments, duplicate submissions, and basic sender validation so the queue does not fill up with junk.
Manual upload works for a one-time audit. It breaks down once you want continuous monitoring.
In practice, the first durable step is to store every report with metadata such as reporting organization, covered date range, recipient domain, and message identifier. That gives you traceability when two receivers report the same source differently or when a provider resends a file. Teams that skip this usually end up debugging their parser instead of their mail estate.
Parsing and normalizing into a common schema
Once the XML is collected, the analyzer extracts the fields that matter for operations and maps them into a common record format. Receiver reports are similar, but not identical. Some bundle records differently. Some are stricter about formatting. Some include edge cases that break naive parsers.
A practical normalized schema usually includes:
- Reporting org and time window
- Header-from domain
- Source IP
- Message count
- SPF result and aligned domain
- DKIM result, selector, and aligned domain
- Receiver disposition
- Policy mode and subdomain policy
This normalization step determines whether your dashboard reflects reality or fragments it. A single SaaS sender can otherwise appear as multiple unrelated issues because one receiver labels it one way and another receiver labels it differently.
The same design problem shows up in broader security reporting software. Raw findings arrive from many systems, but analysts need one model for sorting, ownership, and escalation. DMARC analysis has the same constraint.
Correlating records into something an operator can use
Parsing XML is the easy part. Correlation is where an analyzer starts to earn its keep.
Useful analyzers group records by source IP ranges, sending provider, aligned domain, and trend over time. They also deduplicate repeated records and flag changes that matter, such as a source that passed DKIM yesterday and now fails alignment, or a new sender that appears only at one receiver. That is the difference between a parser and a monitoring system.
If you already run log pipelines, the pattern will feel familiar. Reports come in, fields get normalized, enrichment maps IPs or domains to known services, and the resulting events land in search or time-series storage for dashboards and alerting. The trade-off is straightforward. More enrichment improves triage speed, but it also means maintaining lookup tables for vendors, owned infrastructure, and approved third-party senders.
Here's a useful walkthrough before going further:
Presenting the output for action
The final layer is presentation, but the goal is not prettier charts. The goal is faster decisions.
A usable analyzer answers questions an on-call engineer or email owner can act on right away:
- Which senders are new since the last review
- Which failures are caused by alignment, not just authentication
- Which sources generate enough volume to justify immediate remediation
- Which receivers are enforcing policy differently
- Which trends suggest you can tighten policy safely
Poor dashboards expose every parsed field and call that analysis. Good dashboards reduce the queue. They group by sender, highlight drift, and make ownership obvious. If the tool cannot help your team decide whether to fix DNS, contact a vendor, block an unauthorized sender, or leave expected traffic alone, it is still just XML in a nicer wrapper.
Interpreting Your Analyzed DMARC Data
Once the reports are readable, the substantive analysis begins. Many teams don't struggle because they lack data. They struggle because they aren't sure what deserves action.

Start with sender inventory
The first thing to ask isn't “what failed?” It's “who is sending?” A DMARC dashboard is one of the few places where shadow IT around email becomes visible. Marketing platforms, CRM automation, support tools, invoicing systems, and internal apps often show up here before they show up in documentation.
That's why sender discovery should be the first pass in review. Build a simple mental split:
| Sender type | Typical interpretation | Immediate action |
|---|---|---|
| Recognized and compliant | Expected traffic | Monitor, don't over-handle |
| Recognized but failing | Misconfiguration or drift | Open remediation work |
| Unknown and low volume | Investigate before dismissing | Check owner and purpose |
| Unknown and suspicious | Potential abuse or unauthorized use | Escalate quickly |
Separate authentication from alignment
A lot of confusion comes from treating SPF or DKIM pass results as the finish line. They aren't. In DMARC, alignment matters. A service can authenticate successfully in a technical sense while still failing DMARC because the authenticated identity doesn't line up with the domain you're protecting.
That's why dashboards need to be read with care:
- SPF pass but DMARC fail: Often a return-path identity mismatch
- DKIM pass but DMARC fail: Often a signing domain mismatch
- SPF fail but DKIM aligned: May still be acceptable under DMARC
- Both failing: High-priority remediation or likely unauthorized use
Don't treat “SPF passed” as reassurance on its own. The enforcement decision follows DMARC logic, not isolated protocol wins.
Look for change, not only failure
The most useful review habit is trend comparison. Teams often ask the right operational questions only after a deliverability problem lands in support. They want to know what changed this week, which third-party sender caused it, and how to route that into alerting or ticketing. Open-source tooling like parsedmarc paired with Elasticsearch is a strong signal that basic parsing isn't enough for monitoring at scale, as noted in the parsedmarc project documentation.
That point is easy to miss. A dashboard snapshot can tell you current state. It won't always tell you whether a source is newly broken, newly active, or steadily noisy unless you preserve history and compare over time.
Read disposition as receiver behavior
Disposition tells you what the receiving side did with the message under your DMARC policy. That's where security posture meets delivery impact.
When you review disposition, ask:
- Are failing messages still being accepted under a monitoring policy?
- Would stricter enforcement break a known sender?
- Are receivers handling the same failure pattern consistently?
Operator note: The best dashboard view isn't the prettiest chart. It's the one that lets you isolate one sender, one failure mode, and one time window in a few clicks.
If your analyzer can't answer those questions quickly, the next step isn't another dashboard. It's better data consolidation.
Operational Playbooks for Triage and Remediation
A DMARC report analyzer is only useful if it shortens the path from detection to action. The most effective teams don't stare at dashboards for long. They use consistent playbooks.
Unknown sender appears
You find a source you don't recognize. Don't authorize it just because the volume looks small, and don't assume it's malicious just because it's unfamiliar.
Use this sequence:
- Check whether the source is recurring. If it appears across multiple reporting periods, it may be a legitimate system someone forgot to document.
- Map it to a business owner. Ask marketing, support, finance, and engineering which tools can send on behalf of the domain.
- Classify before changing anything. There are only three useful outcomes: approve and configure, retire and stop, or escalate as suspicious.
The common mistake is skipping owner identification and jumping straight to DNS changes. That creates long-term confusion.
Known vendor is failing DKIM or SPF
This is the most common remediation path. The sender is real. The configuration isn't.
A clean workflow looks like this:
- Capture evidence: Pull the exact sender identifier, failure mode, and date window from the analyzer.
- Open one owner-facing ticket: Don't scatter the issue across chat threads.
- Ask one question first: Is this sender supposed to align through SPF, DKIM, or both?
That last question matters because vendors differ. Some support aligned DKIM cleanly. Others rely on patterns that make SPF or alignment harder to sustain.
When contacting a vendor, send the failure pattern, not a vague complaint about deliverability. “DKIM signing is misaligned for mail from this service” gets faster action than “emails are failing DMARC.”
If the source is meant to be legitimate, keep the remediation scoped. Fix the authentication path, monitor the next reports, and confirm the sender moves into the expected state.
Preparing to tighten policy
The jump from monitoring to enforcement shouldn't be based on optimism. It should be based on observed sender behavior. In this way, analyzer history helps de-risk change.
Before tightening policy, review three things:
| Check | What you want to see | Why it matters |
|---|---|---|
| Known senders | A stable inventory | Prevents surprise failures |
| Failure clusters | A small, understood set | Avoids broad collateral damage |
| Alignment health | Legitimate services behaving consistently | Reduces enforcement risk |
If you're managing DNS changes across providers or registrars, operational cleanliness matters as much as policy planning. This walkthrough on Namecheap DNS setup is useful when the bottleneck is getting changes published correctly and predictably.
Route findings into operations
The dashboard isn't the system of record. Your ticketing, alerting, and ownership model is. Build a rule for what enters the queue.
A practical split works well:
- Security queue: Unknown or suspicious sender activity
- Platform or email ops queue: Legitimate services failing alignment or auth
- Application team queue: Internal systems sending in ways that weren't approved
That separation keeps your security review from getting clogged with normal vendor setup issues, and it keeps platform teams from ignoring potentially unauthorized use.
Automating DMARC Analysis for Developer Workflows
Monday starts with a familiar mess. A shared mailbox has filled up with compressed XML attachments from Google, Microsoft, Yahoo, and a few regional receivers. Nobody wants to open them by hand, and nobody should. At that point, DMARC stops being a reporting task and becomes an ingestion problem.

Build the pipeline like log ingestion
The practical design is simple. Reports arrive in a dedicated mailbox. A worker pulls messages over IMAP, extracts attachments, parses the XML, normalizes fields across receivers, and writes the result into a store your team can query.
That store can be Elasticsearch, Postgres, BigQuery, or even S3 plus Athena if the volume is still modest. The right choice depends on who needs access and what questions they ask. Security teams usually want sender and IP pivots. Platform teams care about service-level failure trends and whether a DNS change fixed the issue. If the storage layer cannot answer those questions quickly, the analyzer becomes another dead-end dashboard.
What automation should actually do
Automation needs to reduce manual sorting and shorten the path to action.
A useful baseline includes:
- Mailbox collection: Pull reports on a schedule so nobody downloads ZIP files by hand
- Normalization: Map receiver-specific XML into one internal schema
- Deduplication: Suppress reprocessed reports and repeated alerts from the same reporting window
- Classification: Tag records as known sender, unknown sender, alignment failure, auth failure, or policy-risking change
- Routing: Send high-confidence issues to the right system, whether that is Slack, PagerDuty, Jira, or your SIEM
- Retention and history: Keep enough normalized data to compare this week against last week
The key design choice is trigger quality. Weekly review is fine for low-volume domains, but engineering teams get better results from event-based checks. Alert when a new source starts sending, when a previously aligned vendor starts failing, or when one application suddenly shifts traffic to an unrecognized IP range. Those events have owners. A raw increase in report volume usually does not.
Fit DMARC into the delivery pipeline
The better teams do not treat DMARC analysis as a separate security chore. They attach it to change management.
If a vendor is added, add its expected SPF and DKIM footprint to your sender inventory. If an app team changes an email provider, require a post-change check against analyzer output. If marketing launches from a new platform without going through review, the analyzer should expose that within a day and create a ticket automatically. That is the feedback loop basic parsers miss. Parsing tells you what happened. Automation decides who needs to fix it and how fast.
For teams building this into broader mail operations, a checklist of email security best practices helps keep DMARC automation tied to SPF, DKIM, access control, and sender inventory work instead of running as an isolated script.
Where teams waste effort
I see two common mistakes.
The first is overbuilding early. A full SIEM pipeline, custom scoring model, and polished dashboard are not the first milestone. Start with collection, normalization, ownership tags, and a small set of alerts that map to real remediation steps.
The second is automating noise. If every transient SPF miss opens a ticket, people will mute the system. Good DMARC automation is selective. It favors repeat failures, policy-impacting regressions, and unknown senders over one-off anomalies. The goal is fewer judgment calls, not more.
A working analyzer pipeline should answer four operational questions fast: what changed, who owns it, how risky it is, and whether the fix worked. If it cannot do that, keep simplifying until it can.
Security Privacy and Monitoring Best Practices
DMARC reports help you see who is sending on your domain's behalf, but that visibility comes with its own handling risk. Aggregate XML files can expose internal mail infrastructure and vendor relationships, which is one reason there's growing interest in client-side and open-source analyzers that emphasize browser-side parsing without requiring an account, as explained in this discussion of privacy-preserving DMARC report analyzers.
That trade-off deserves more attention than most tool pages give it. If your organization is regulated, or if your mail ecosystem reveals sensitive vendor relationships, treat report handling as security data handling. Choose storage deliberately. Limit retention. Decide whether cloud upload is acceptable before someone drags reports into a random web parser.
For ongoing review, keep the cadence simple and strict:
- Watch for new senders: New sources deserve classification quickly.
- Track recurring failures: Repeated auth or alignment problems need ownership.
- Review policy impact: Don't tighten enforcement without recent evidence.
- Preserve context: Store enough history to explain changes over time.
If you want a broader operational checklist around mail hygiene beyond DMARC alone, this guide to email security best practices is a useful companion.
A DMARC report analyzer shouldn't be treated as a one-time setup tool. It's part of the domain's monitoring surface, and it works best when privacy, ownership, and review cadence are designed into the workflow from the start.
If you're building autonomous systems that need to receive DMARC reports, route inbound mail programmatically, and turn email events into developer-friendly workflows, Robotomail is worth a look. It gives AI agents real mailboxes through API, supports inbound handling through webhooks, server-sent events, or polling, and supports custom domains with auto-configured DKIM, SPF, and DMARC. That makes it a practical fit for teams that want email-enabled agents without the usual SMTP, OAuth, and manual provisioning overhead.
Give your AI agent a real email address
One API call creates a mailbox with full send and receive. Webhooks for inbound, automatic threading, deliverability handled. 30-day money-back guarantee.
Related posts
How to Read DMARC Reports: Master Deliverability in 2026
Learn how to read DMARC reports and diagnose email delivery issues. Our 2026 guide covers XML parsing, SPF/DKIM results, and analysis automation.
Read post
How to Publish DMARC Record: A 2026 Guide
Learn to publish DMARC record in DNS, from TXT syntax to enforcement, to boost email deliverability in 2026.
Read post
How to Configure SMTP Host for Reliable Email Delivery
Learn how to configure SMTP host settings including ports, TLS, authentication, and DNS records. Practical steps, testing methods, and common error fixes.
Read post